Skip to content

A.Z. Andis Arietta

Ecology, Evolution & Conservation

  • Home
  • Research
    • Publications
    • Evolution
    • Road Ecology
    • Wilderness
  • Blog
  • About
    • Bio

data science

Wild Idea Podcast

July 21, 2025 azandis@gmail.com

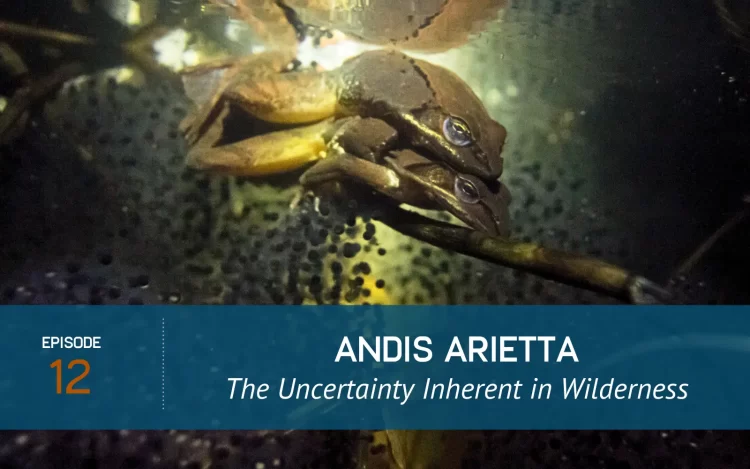
I recently joined my dear friend Bill Hodge on the The Wild Idea Podcast for a conversation about ecological resilience, climate adaptation, and how we think about wilderness in a […]

 evolution, road ecology, wilderness  Alaska, commentary, conservation, data science, dispersal, divergence, ecology, evolution, local adaptation, microgeographic, outreach, presentation, road ecology, wilderness, wood frog

Structural Equation Modeling in R

July 24, 2024July 25, 2024 azandis@gmail.com

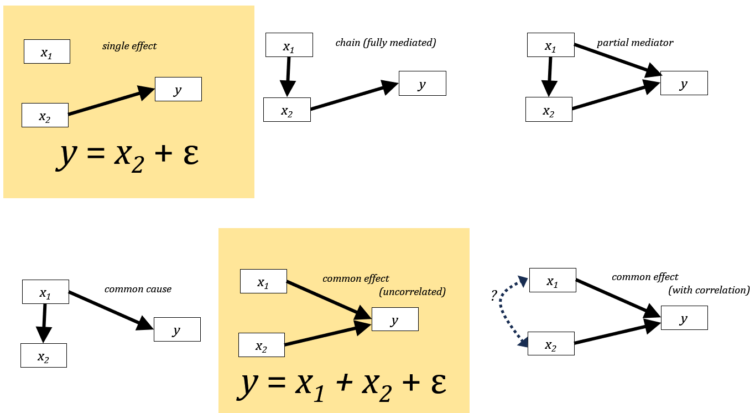
Introduction Today we are talking about structural equation models (SEM). There are lots of synonyms, sub-categories, and adjacent techniques that you may have heard before–covariance structure analysis, linear structural relations, […]

 data science, research, Uncategorized  data science, how to, project portfolio, R, research, statistical model, tutorial

Plotting custom models with ggplot2 in R

November 5, 2022October 9, 2023 azandis@gmail.com

Last week, I attended a talk at our local Yale data science group by my friend Matteo in which he presented an overview of ggplot2. During the questions after the […]

 data science  data science, data visualization, GGplot, project portfolio, R

Tags

academia Alaska art bear book review canopy estimates commentary conservation data science data visualization dispersal divergence ecology embryonic development EPA evolution expedition field notes forest GGplot hemispherical photography how to kayak local adaptation methods microgeographic microscopy outreach PhD phenology photography presentation project portfolio published R research road ecology salamander spherical photography statistical model tutorial vernal pond wilderness wolves wood frog

Categories

Recent Posts

  • Wild Idea Podcast

  • Structural Equation Modeling in R

  • tsne plot and hierarchical tree diagram displaying the data split into 8 clusters

    Text analysis using AI in R

Contact

A. Z. Andis Arietta, PhD
Yale University
andis.arietta@aya.yale.edu

[instagram-feed feed=3]