Skip to content

A.Z. Andis Arietta

Ecology, Evolution & Conservation

  • Home
  • Research
    • Publications
    • Evolution
    • Road Ecology
    • Wilderness
  • Blog
  • About
    • Bio

data visualization

tsne plot and hierarchical tree diagram displaying the data split into 8 clusters

Text analysis using AI in R

October 5, 2023October 9, 2023 azandis@gmail.com

Introduction Analyzing qualitative data is challenging. Such analyses are even more difficult when the topic is controversial and the results will drive important policy decisions. This post explores AI methods […]

 data science, Uncategorized, wilderness  conservation, data visualization, ecology, EPA, GGplot, project portfolio, R, wilderness, wolves

Visualize mixed effect regressions in R with GGplot2

December 31, 2022October 9, 2023 azandis@gmail.com

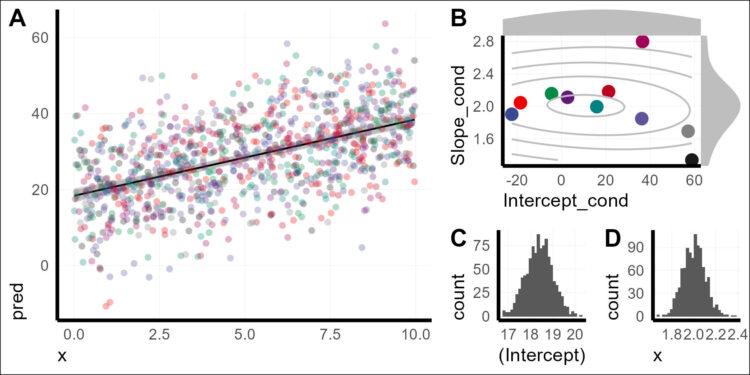
In this post, I will show some methods of displaying mixed effect regression models and associated uncertainty using non-parametric bootstrapping. This is kind of a follow-up to my previous post […]

 Uncategorized  data visualization, GGplot, methods, project portfolio, R, research, statistical model
Biomass pyramids for an aquatic and terrestrial ecosystem.

Biomass Pyramids and Funnel Plots in R with GGplot2

November 22, 2022October 9, 2023 azandis@gmail.com

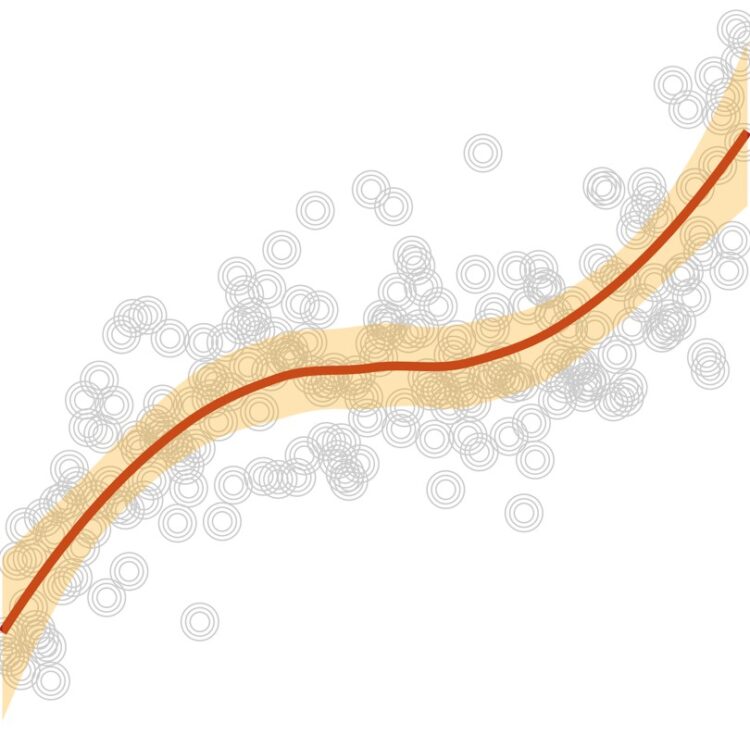
Every once in a while, I come across a plot form that is not in my ggplot repertoire. For example, I occasionally want to make a funnel plot in my […]

 data science  data visualization, GGplot, how to, project portfolio, R

Plotting custom models with ggplot2 in R

November 5, 2022October 9, 2023 azandis@gmail.com

Last week, I attended a talk at our local Yale data science group by my friend Matteo in which he presented an overview of ggplot2. During the questions after the […]

 data science  data science, data visualization, GGplot, project portfolio, R
Infographic depicting the most common and most unique words used to describe US Wilderness Areas

Web scraping and text analysis in R and GGplot2

August 30, 2022October 9, 2023 azandis@gmail.com

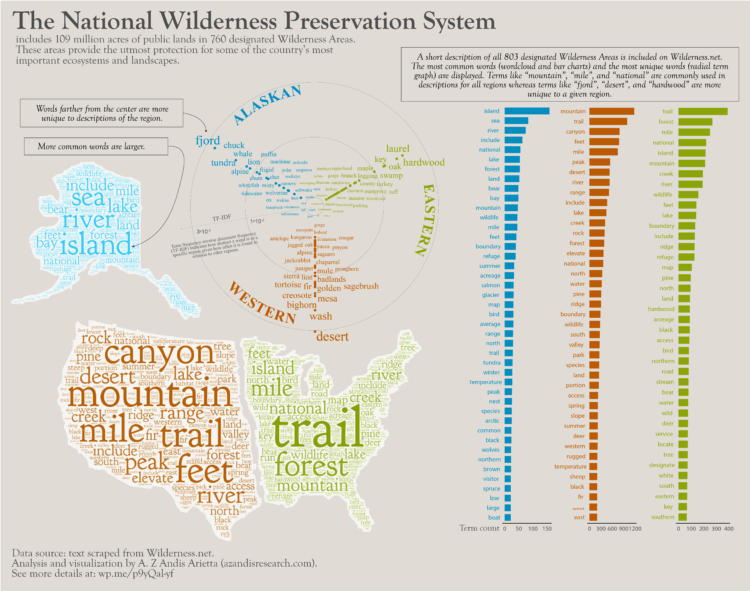
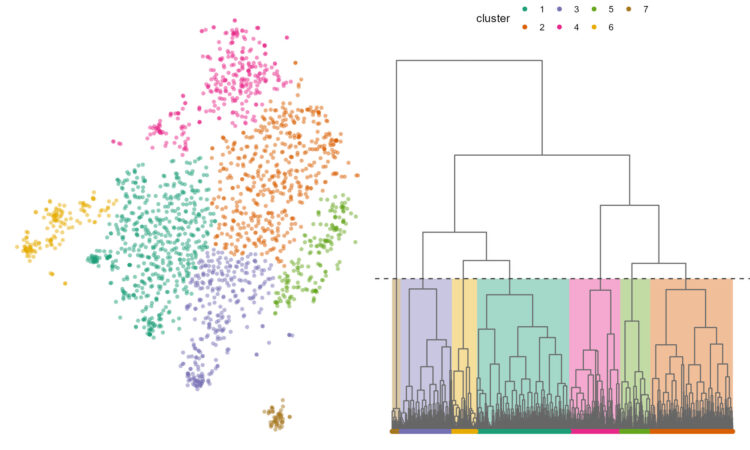
I recently needed to learn text mining for a project at work. I generally learn more quickly with a real-world project. So, I turned to a topic I love: Wilderness, […]

 research, wilderness  data visualization, GGplot, how to, project portfolio, R, wilderness

Species range maps with GGplot

August 30, 2021October 9, 2023 azandis@gmail.com

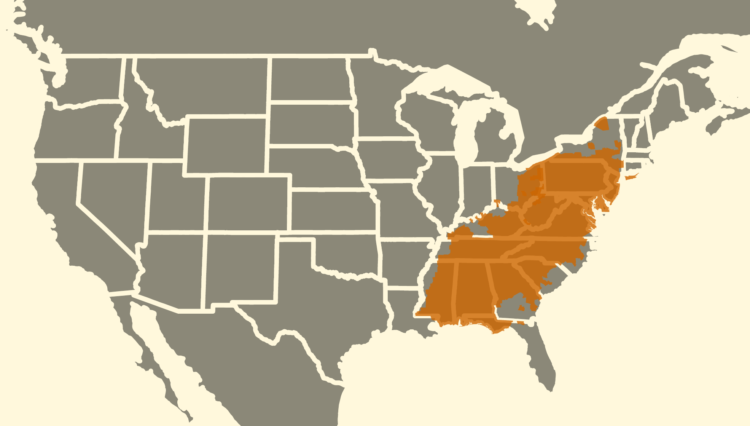
The other day, I wanted to tweet out a map showing the distribution of some wood frog tissue samples compared to the entire range of the species. I’m not much […]

 research  academia, data visualization, GGplot, project portfolio, R, research

The Anatomy of Data Viz

October 7, 2020October 8, 2020 azandis@gmail.com

When I first started in communications, data viz was hard. You basically had to have a serious knowledge of Adobe Illustrator and Photoshop. At that time, “New Media” was just […]

 Uncategorized  academia, data visualization, presentation

How to avoid giving terrible presentations

November 11, 2019November 11, 2019 azandis@gmail.com

Recently, I gave a presentation to a class of Yale Masters students about how to give better scientific presentations. This is a topic I think about a lot, coming from […]

 Uncategorized  academia, data visualization, presentation

Create a radial, mirrored barplot with GGplot

July 19, 2019October 9, 2023 azandis@gmail.com

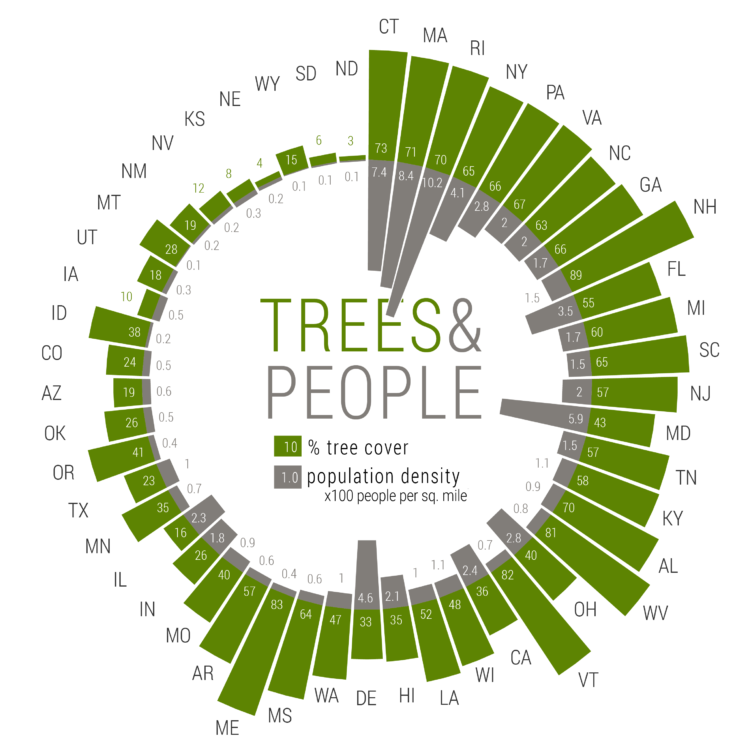
  Among other topics, my lab studies the relationship between forest obligate frogs and urbanization. During a seminar, I once heard my advisor mention that Connecticut is the perfect state […]

 research  data visualization, forest, GGplot, how to, outreach, project portfolio, R

Visualizing evolutionary divergence

December 7, 2017October 9, 2023 azandis@gmail.com

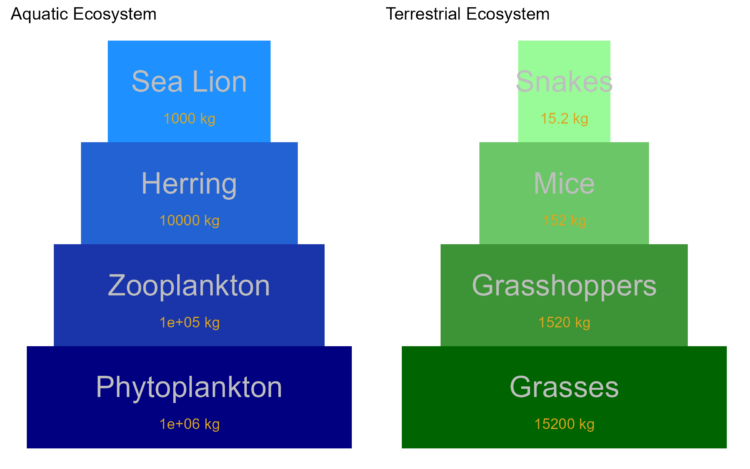
One of the funny conventions in ecology is the practice of naming a new statistical unit after a preeminent ecologist. For instance, in 1949 J.B.S. Haldane proposed a new unit […]

 evolution, research  data visualization, dispersal, divergence, evolution, local adaptation, microgeographic, project portfolio, research

Tags

academia Alaska art bear book review canopy estimates commentary conservation data science data visualization dispersal divergence ecology embryonic development EPA evolution expedition field notes forest GGplot hemispherical photography how to kayak local adaptation methods microgeographic microscopy outreach PhD phenology photography presentation project portfolio published R research road ecology salamander spherical photography statistical model tutorial vernal pond wilderness wolves wood frog

Categories

Recent Posts

  • Wild Idea Podcast

  • Structural Equation Modeling in R

  • tsne plot and hierarchical tree diagram displaying the data split into 8 clusters

    Text analysis using AI in R

Contact

A. Z. Andis Arietta, PhD
Yale University
andis.arietta@aya.yale.edu

[instagram-feed feed=3]